Kickstarter : Interactions with the backers and success
Click here to see my Excel file
Click here to see my presentation.
Click here to have the raw data.
Skills Involved :
Data cleaning
Excel : pivot Table, INDEX / MATCH
The original goal was to make clear recommendations on how people can create a successful Kickstarter campaign.
PART 1: Data Handling
Of course, a Kickstarter is to fund a specific project. I cannot force people to make a project they don’t want because it could be more successful. So I decided to focus on metric not linked to the type of projects :
Number of levels
Numbers of updates
Campaign duration.
The datasets contains 41835 and 19 features by projects.
I used Excel advanced filter tools to see all the unique categories and sub categories of Kickstarter campaign. I was able to detect and correct misspelled values (probably due to encoding error of ‘&’).
I used excel INDEX /MATCH function to transform a numerical data (goal of the campaign) to a categorical data (Low - Medium - High).
I handled some outliers and chose to select only part of the data.
Part 2 : First Analysis.
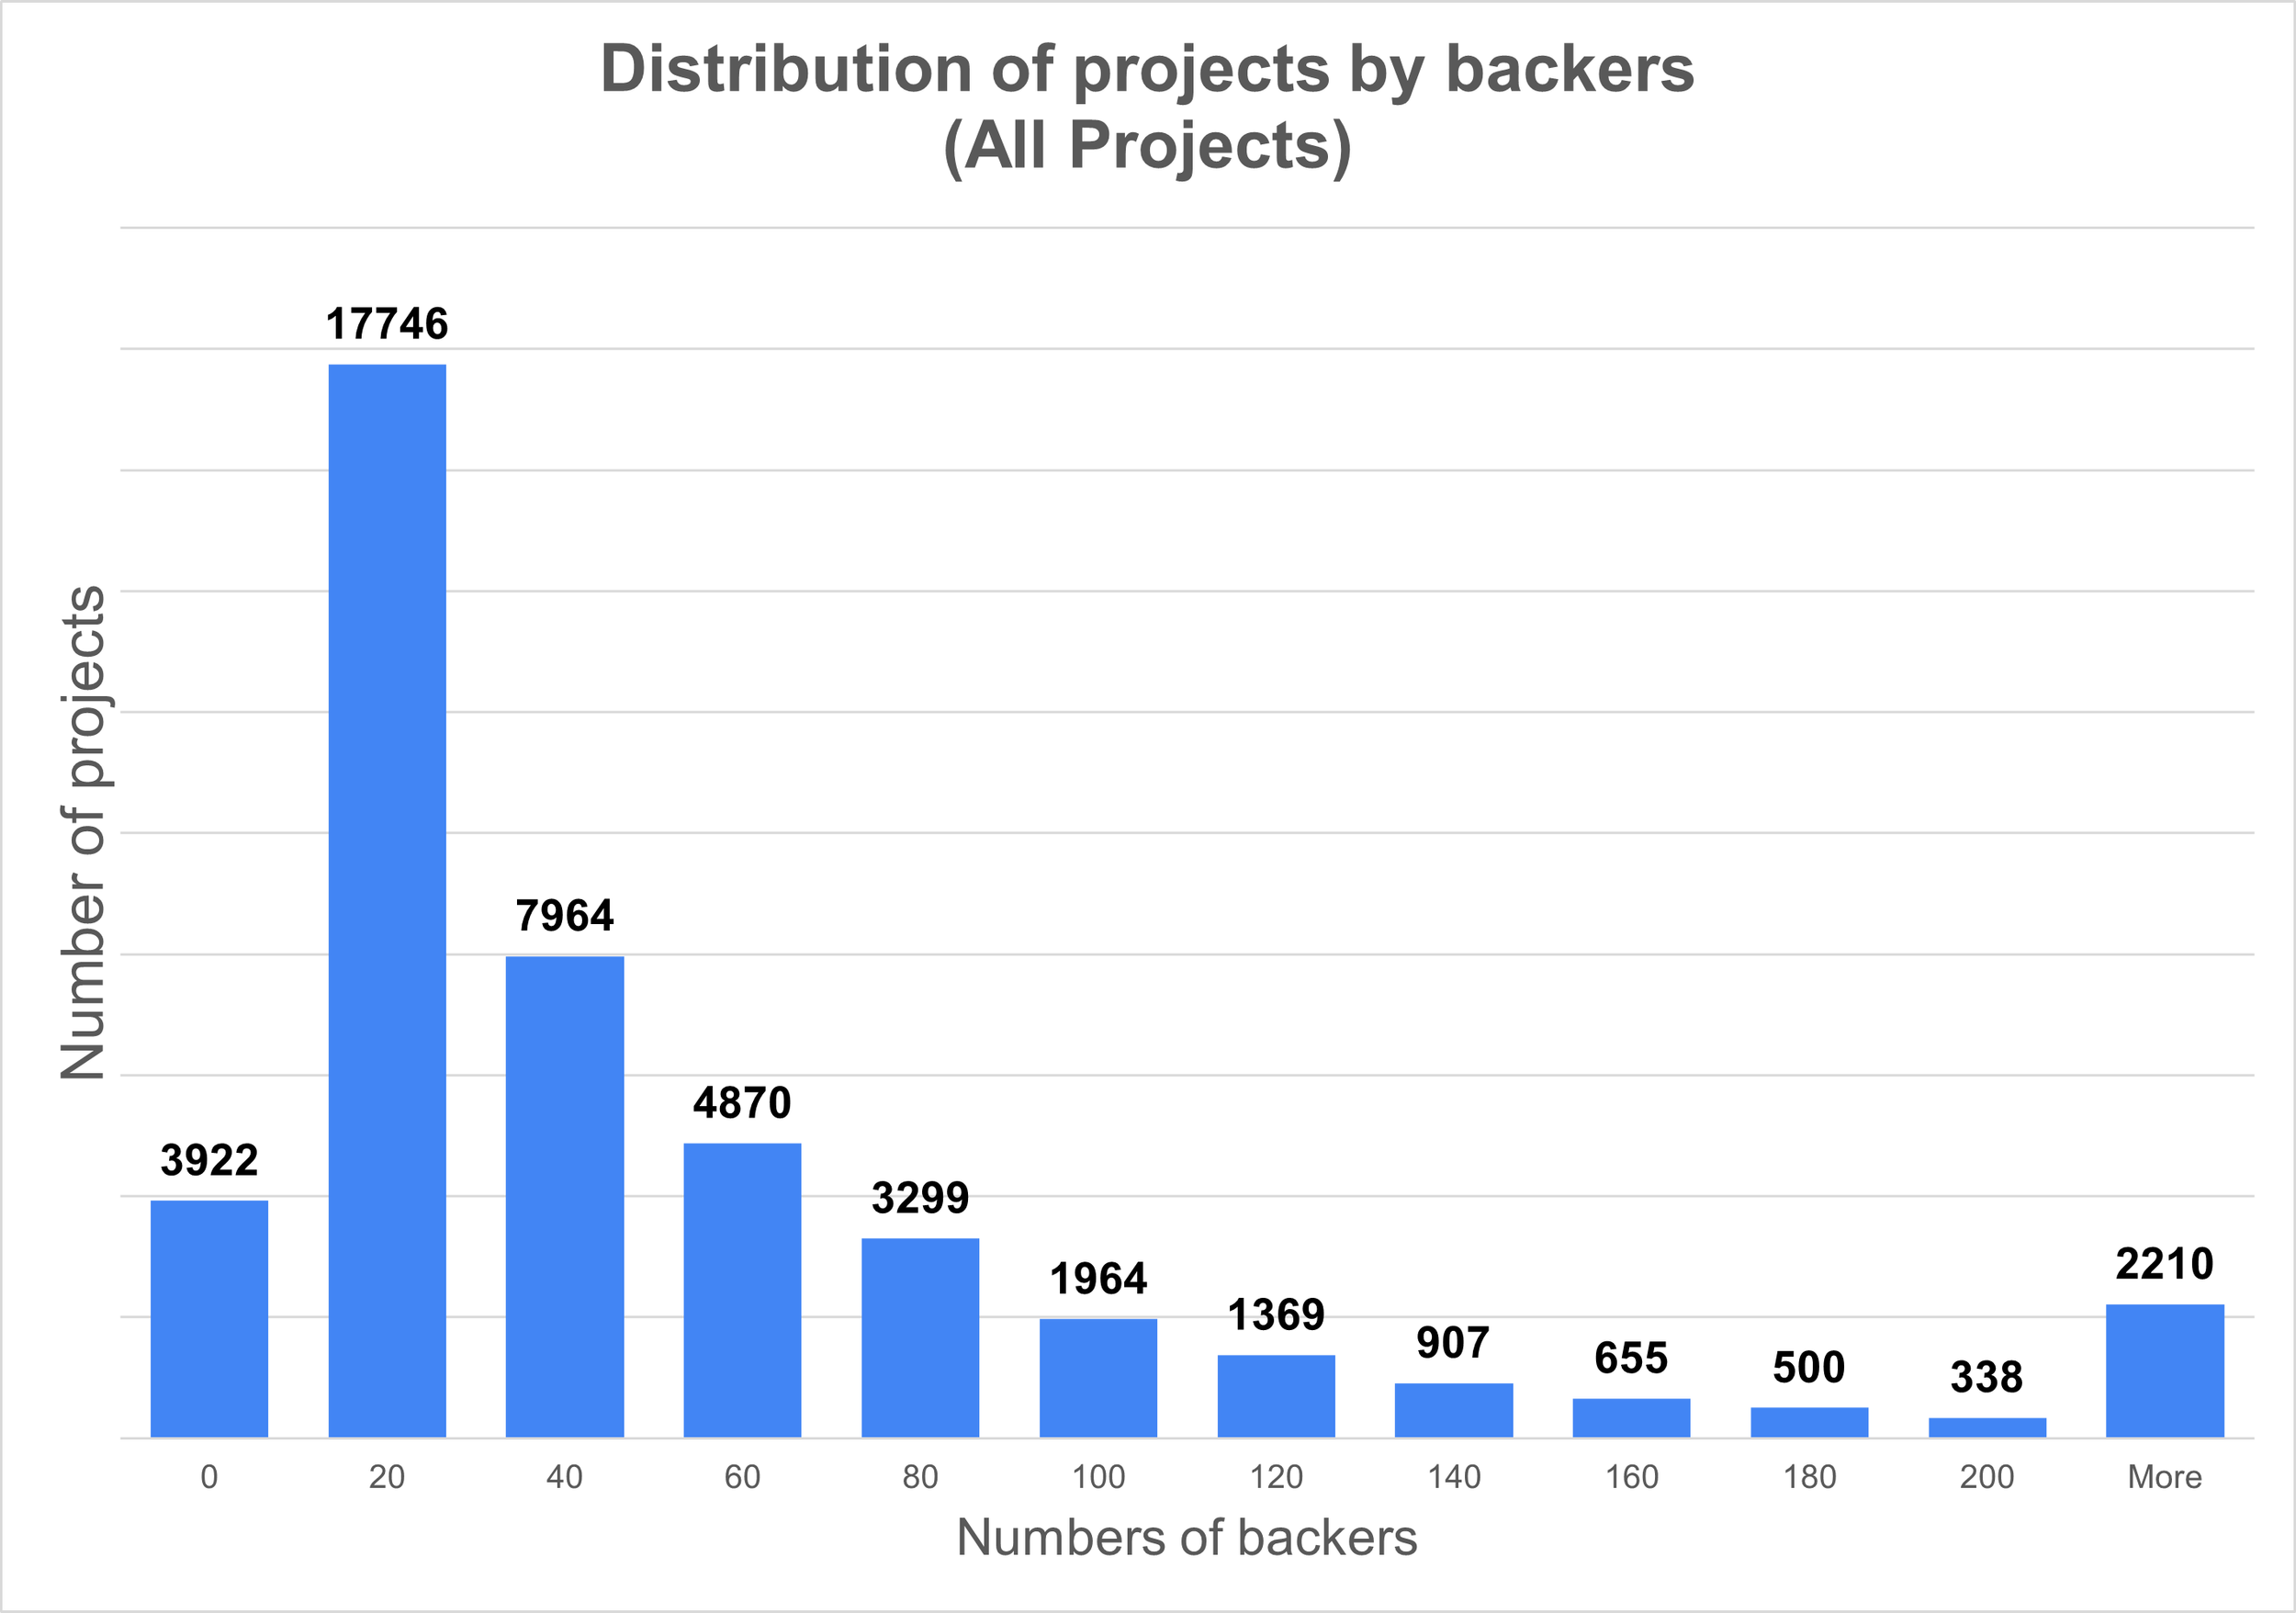
It is very hard to attract baker. 1/4 of project have less than 5 backers.
Half reach less than 25 backers. While half of successful projects reach more than 52 backers.
PART 3 : Interaction with backers
The more comments there are from the project owner, the more successful the project is.
But correlation is not causality. Indeed, if a project is successful, the project’s owner is able to work on it with the new funds, and will post updates of the progress to his backers.
We can draw the same conclusion for the number of levels available to backers. If the demand for a product is high, the creator is encouraged to increases offer by adding more expensive level.
However, as you can see on the right, project with 0 or 1 comment have a very low rate of success. I encourage a creator to quickly make a comment after receiving a first backer.
What did I learn and how to go deeper ?
I handled errors in data and duplicate rows.
I carefully identify the difference between correlation and causality.
By calculating correlation, analysis can be more efficient by understanding what the independent variables really are.
To understand the correlation, more data are needed : dates of updates and dates when the project’s creator added a new level.

